
July 23, 2001: WZ Sge is marked with two white bars. The star few arcminutes south is GSC 1621:1830. In the smaller box, on the bottom right, the star looks more than 1.5 mag. fainter (as on Aug 10.8).

On July 23, 2001 an outburst for this important variable was detected by T. Ohshima (Japan) and reported to VSNET by T. Watanabe. On July 23.2233 UT the star was at mag. 9.7. In the history of this object we have only three previous outbursts (1913 Nov. 27, 1946 June 28, and 1978 Dec.. 1). So, this is the first outburst in moder-age, with the star very well located for all-night coverage.
Just after the first alert, astronomers at Kyoto observed the raising trend from mag. 9.7 to mag. 8.7 in only 5 hours. They did time-series photometry, finding that the star was showing short-term modulation, superimposed to the ascending trend. I was really hoping to have a chance to observe!
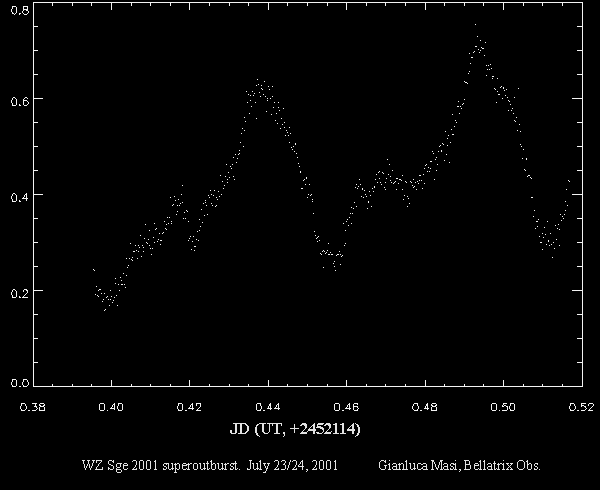
That night the sky was clear at Bellatrix Observatory and, fortunately, I had enough free time to observe. I found the star at mag. 8.4 (unfiltered) on July, 23.893 UT. I started time-series photometry in order to observe the behaviour of the star. I grabbed about 600 frames, reduced the following day. Actually, I expected to see the very same thing observed in Kyoto but, fortunately, I was disappointed when I plotted the light curve: "Impressive!", I said... and I had to wait for some minutes to restart working after that great emotion. The curve gives many details on the star. Here is a more detailed report:
"Time-resolved, unfiltered differential photometry has been performed by Gianluca Masi from July 23.89 to July 24.01 [reference star: GSC 1621:1830 (V=8.76, R=8.64- the latter an indication by B. Skiff for this A2-type star)]. The resulting lightcurve, with a good signal-to-noise ratio, shows large variations (0.5 mag); also, three eclipses are very well visible, in good agreement with the ephemeris provided by Kato on VSNET. The distance in time among these eclipses is about 82 minutes (and the same period is for primary maxima). Superimposed to this main trend there is another evident, smaller but strong modulation (probably developing superhumps). Also main maxima (and minima) clearly give the impression that the star was still rising during the observing run, with a trend of 0.9 mag/day."
The amazing light curve is visible below.
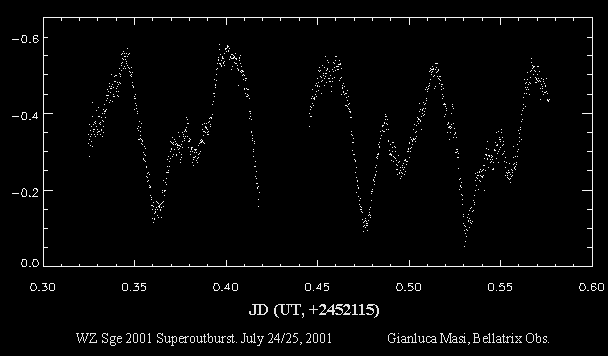
The following day I was tracking the star again; I managed to observe for 6 hours. The light curve shows 3 eclipses and 5 peaks (one eclipse was missed because of a minor problem to the scope). Oscillations of about 0.45 mag are clearly visible and the main maxima are now less than 82 minutes apart. The Kyoto team, using our observations, found a period candidate of 0.0566d. So, the very first night that star was humping with a period actually longer than that reported in 1978 for superhumps. Another modulation, smaller (0.15 mag) but strong is visible, as reported yesterday. But today this signal appears with a better definition and I was wondering if it was connected with growing superhumps (also yesterday, and this turned to be true!). It seems like there are two kinds of secondary maxima: sharper and broader, well visible in the curve below.
This is a zoom on the first eclipse, a bit flatter than the others. Could this be a signal that the eclipse profile is changing (see below)?

On July 25/26 I've got other useful data, and
the corresponding curve is below. It clearly shows the main features previously
recorded. The amplitude of the main modulation is a bit smaller (0.4 mag)
and there is a quite large (in time) first secondary maximum, while the
other ones are sharper, with the exception of the last one, with a very
particular shape. So, the secondary peaks seem to confirm that they can
be of two types (but confirmation is needed): sharp or broad. Looking at
the second eclipse, it has a different shape, broader then the first one
(but also yesterday I discussed a particular eclipse looking flatter than
the others; see above); the third ecplise shows a similar profile too.
The main maxima have now a more regular aspect, as the previous day their
shape was both sharp or a bit broader, while now they are all quite sharp
and well-defined. It seems like the star has undergone an evident change
in its behaviour. By the way: the star looks about 0.2 mag fainter than
yesterday. The small noise in the third peak is dued to some clouds.

On July, 26/27 I performed time-series photometry
with Franco Mallia, at Campocatino Astronomical Observatory. The resulting
lightcurve (as always, very impressive) shows that the features previously
reported are still strong. We observed three main maxima and two eclipses.
The shape of these ecplises is quite sharp. The secondary maxima are very
interesting. As previously reported by G. Masi, they continue to be of
two different kinds. We note that the modulation reduced its amplitude
to 0.3 magnitudes. During the run, the star faded of about 0.05 magnitudes.

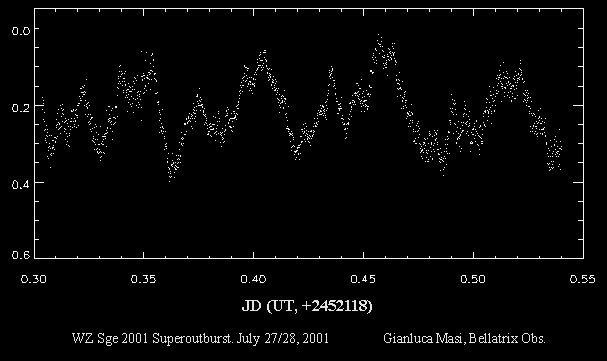
On July, 27/28 I still performed time-series photometry.
The resulting lightcurve clearly says that deep changes are undergoing
there. The main maxima clearly reduced their amplitude and the behaviour
is more complex, with many secondary peaks superimposed to the previous
scenario. It seems that smaller-scale fluctuations are becoming dominant.
Now, all the main maxima have a sort of little "dip" just on their top.
Follow-up is strongly needed.
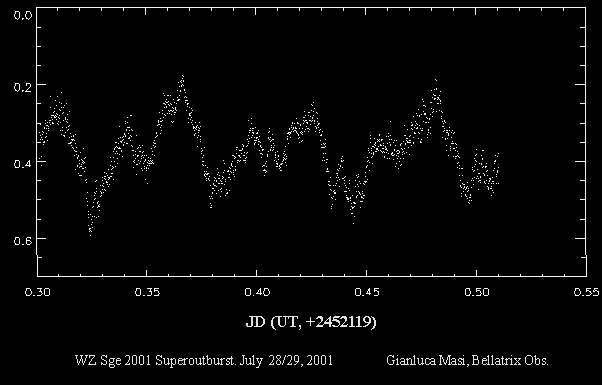
On July, 28/29 I was still measuring this marvelous
star.With great surprise, the first part (almost 50 percent) of the lightcurve
is more regular than yesterday, even if not as few days ago. But the second
part is more complex, like yesterday. A look to the curve seems to show
that the period of the major peaks is a bit longer than the period of eclipses...
Maybe that superhumps are emerging and so follow-up and a close monitoring
is definitely important!
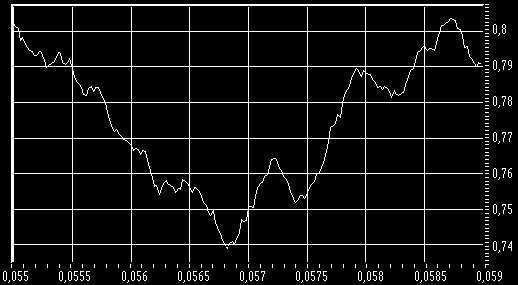
On July 31/aug. 01 I did my 7th run, 6 hours long.
After reduction , I obtained a light curve with a smaller amplitude (0.2
mag) modulation compared to the previous days. The main maxima (and one
has to note that the main maxima strongly reduced their evidence) are not
equally spaced I performed PDM analysis, finding a period estimate of 0.0568d;
for details see the plot I posted below. Also, is interesting to note that
the ecplises, if compared with the ephemerides reported by Dr. Kato in
[vsnet-campaign 1018], clearly anticipate their occurrance of the order
of about 10 minutes. It will be interesting to see if this little increment
in the period will be confirmed.

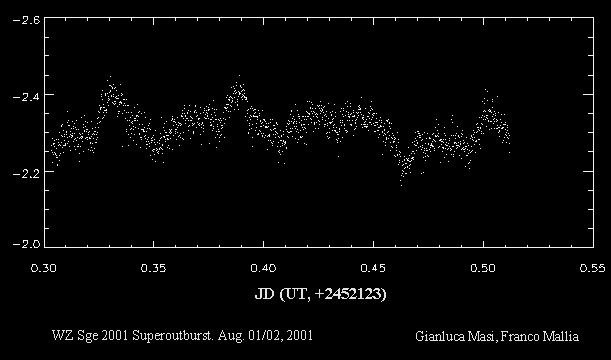
Below is a light curve obtained from a run grabbed
by me and Franco Mallia, at Campocatino Astronomical Observatory. We performed
PDM analysis on this 5-hours run, getting a more probable period of 0.0578d.
We confirm that the profile is broader than ever. The modulation is still
0.2 mag large, with eclipses occuring about 10 minutes early than previsions
from the ephemeris.
Another observing session was planned for Aug.
02/03 and concluded successfully. I did a 6.3-hours run. After reduction,
the resulting light curve is very interesting: it shows two series of maxima
at the beginning of the run, turning to a complex modulation at the end.
The variation is of 0.2 magnitudes. I performed PDM analysis, getting a
period candidate of about 0.0576d (diagram below). I look forward to see
as these new observations will work with the previous dataset.


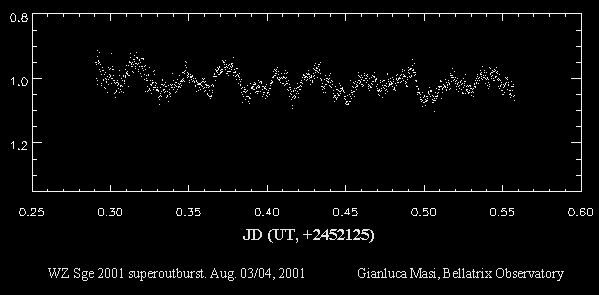
Despite of the full moon and a not very trasparent
sky, I had another run on Aug. 03/04 ; the resulting lightcurve, covering
about 6.5 hours, is of very good quality. The modulation reduced to 0.15mag;
the two series of maxima, which I described since the beginning of the
outburst, are now very similar, but the curve is not regular, as sometimes
small-scale fluctuations are superimposed to the main trend. Main maxima
are broader (even if sometimes they reapear a bit sharper), while secondary
maxima are sharper. While this run, combined with data from Kyoto and B.
Martin, gives a period candidate of 0.056769 +/- 0.000032 d (Taichi Kato,
vsnet-alert 6190), it point to 0.057299 if considered alone.
Superhumps!
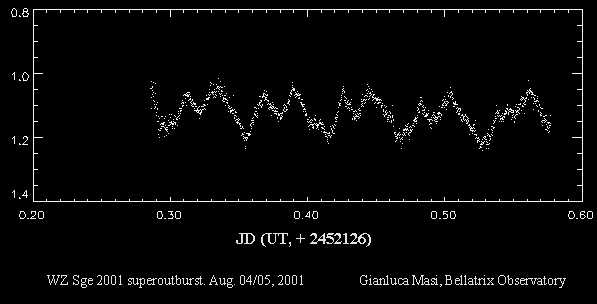
The sky was clear on Aug.04 and I observed for
7 hours, once again getting more than 1500 images. The resulting curve
is amazing. The maxima are now almost equivalent (with some exceptions)
and they look superimposed, resembling the shape of the letter "M". Respect
to the previous night, the modulation is now larger, of about 0.2 mag.
The regular aspect of the modulation, if compared with the previous day,
is very apparent. Period analysis has been performed on the jont observations
of Kyoto and mine, getting, as the most probable period candidate, the
value of 0.057143 +/- 0.000046 d (observations spanning from August 4.44
to 5.08 UT). This estimate so suggest a difference of +0.80 percent respect
to the orbital period (0.05669 d).The incoming days will be very important,
as they will permit to better fix the superhump period and properties.
BTW: it is interesting to note how the finalpart of the curve shows that
the "M"-shaped feature seems to evolve in something different.
A very useful and welcomed wind prepared an incredible
clear sky for the evening of Aug 05/06. Since the beginning of the run,
it wasclear that the S/N was going to be good, despite of the moon, thanks
to the very clear background. So, I managed to get 7 hours of time-resolved
CCD photometry (it was my 12nd session entirely devoted to this star),
resulting in 1441 frames.
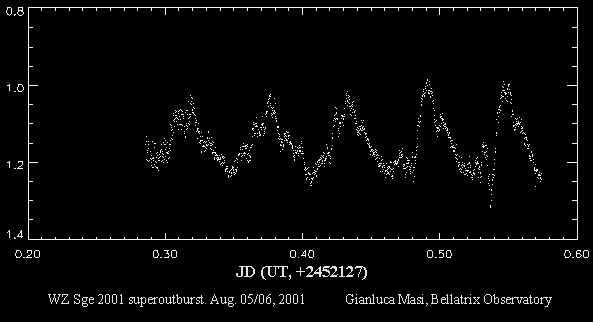
Data reduction clearly shows the appearence of
the long-desired superhumps. The curve aspect is, in some way, specular
respect to the first days, in the sense that now a small, secondary maximum
is in the ascending part of the primary one (superhumps). I performed PDM
analysis by joining my two most recent datasets, getting the value of 0.0582d,
in good agreement with the period found by T. Kato (0.05881d) , based on
several datasets from different observes (me included).
It is interesting to note that the eclipsing
times, assuming they are occurring at the minima of the curve, appear roughly
45 minutes earlier than the previsions (or 27 min later). Please note the particular feature occurred just with the last recorded eclipse. Also, the amplitude
of the modulation is about 0.3 mag, so it increased from last night.
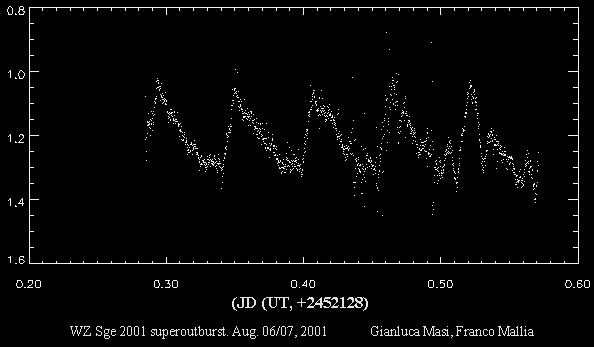
On Aug. 06/07 I performed time-series photometry with Franco Mallia, at Bellatrix Observatory. We managed to get a 7-hours coverage; during the run, always under excellent condition, we had some clouds, and the effects are partially visible on the curve.
The star's behaviour once again changed! Tonight, maxima had a sharper shape than ever, and while the peak was just in the middle of the hump, now it moved toward its left side. During the run, we note a strong evolution, as the maxima actually changed a lot: the first ones were quite simple in their shape, while the other ones had additional features, with the appearence of another small hump, sometimes affecting the primary structure. It is interesting to note that now eclipses are re-occuring in good agreement with the previsions (and they were not doing so the past days!). We performed PDM analysis, getting a period estimate of 0.0571d (combining the latest three dataset).
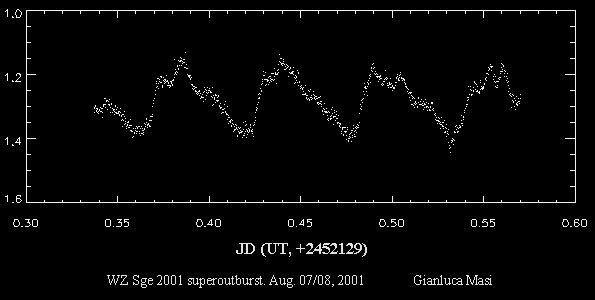
On Aug. 07/08 I still performed time-series photometry with a 5.6-hours coverage; the sky was very excellent and the data quality is very high.
The star's behaviour once again changed! Maxima are showing a more complex shape and they differ each other. Their amplitude is about 0.25 mag. It is very interesting to look at the eclipse shape, as the last one I recorded is very sharp, while the others are broader, especially the first one. Eclipses are now re-occuring in excellent agreement with the ephemeris. The very first part of the run is interesting, as the star forned a clear secondary maximum. I perfordem PDM analysis on the total of my last four runs, getting a probable candidate of 0.0571d.
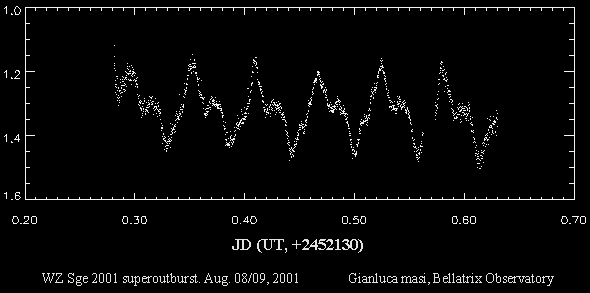
On Aug. 08/09 the sky was excellent. I managed to get my longest run, starting at 18.45 and ending at 03.08, with a hole of 15 minutes. I grabbed more than 1700 frames and the final reduction offered me another memorable "view" on this star.
The light curve is dramatically different from the previous one: sharp maxima, with very marked peaks, have, on the right, a secondary peak (is this the main peak of early superhumps?). The largest modulation is around 0.35 mag. This curve is specular to what we have seen the very first days of the outburst, where the secondary maxima where on the left respect to the main ones. Another, smaller feature is sometimes on the left of primary maxima. The star appear about 0.1 mag fainter than yesterday.
I performed PDM analysis, using mmy last 5 days of data, getting as probable period 0.05708d. Using only this last dataset, I get 0.0573d.
Please note that the session started during the twilight and ended during dawn, with the star quite low.
I've got another good-quality dataset on Aug. 09/10. The run has been 6.8-hours long. As expected, the light curve is
definitely different from last night and it is really outstanding. The curve looks like in my
previous Aug. 04/05 run, where it had the "M" shape. But this time the lower peak is on the
right. It is clear that this curve is the evolution of what I observed yesterday. An amazing feature is just after the eclipses: sometimes star keep a constant brightness for about 20 minutes, while sometimes it has a sort of mini-hump.I was wondering if that quite sharp dip just at the exit of the main feature are the eclipse which are re-appearing. The total amount of variation is 0.3 mag. It is interestin to note how maxima evolves. It looks like there are two systems of maxima, periodically strengthening. I performed PDM analysis over the last 5 runs, getting the probbale period of 0.05742d.
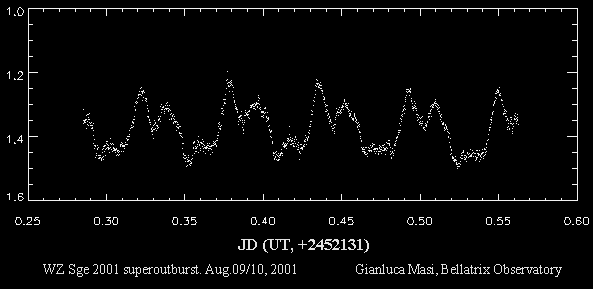
As the sky was clear, I obtained another long run of time-series photometry on Aug. 10/11, for a total of 1810 frames, covering about 8.4 hours. The sky was good, so the curve shows several impressive feature (and, of, course, it is very different from yesterday).
Once again , one can see a sort of "M" feature, but this time the peak on the right is stronger and during the run they seems to superimpose each other! Again, just after the eclipse, there is the mini-hump I reported yesterday, but there is not any 'constant plateau' and there is not a strong evidence of eclipses like yesterday (even if it can be "masked by that mini-hump). The star appears to fade slowly but continuously during the run.
Both the beginning and the final part of the run are a bit noisy, as I started with the sky still very clear, ending with the star low on the horizon and partially involved with some threes along the view.

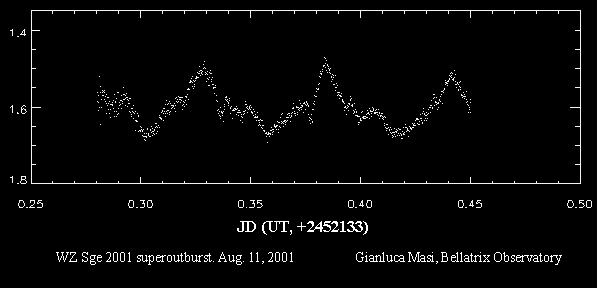
On Aug. 11, 2001 the sky was very clear and I started my observations at 18:43 UT; unfortunately, around 22:50 UT clouds entered my sky, and I stopped my data acquisition, restarting it at 00:10 UT. In the meanwhile, I reduced the 993 frames, once again getting outstanding results, of very high quality.
The curve is dominated by a single, central main peak, having at both its sides two other little humps; the one on the left is single-peaked, while the one on the right is double. Their importance is variable, in the sense that sometimes these secondary peaks are weaker, especially the one on the left.
The star stopped its fading, now being 0.1 mag. fainter than yesterday. I hope to image for another three hours.
On Aug. 12/13 the sky was truly excellent. I started time-resolved photometry, getting more than 1800 images over 8.5 hours.
The resulting light curve shows that something of very importat is happening there. I've found 0.15 mag. superhumps, which shape is this time very simple! Sometimes peaks are sharper, sometimes broader, with very regular
profile. After the peak, there is some flickering and the secondary hump is almost absent
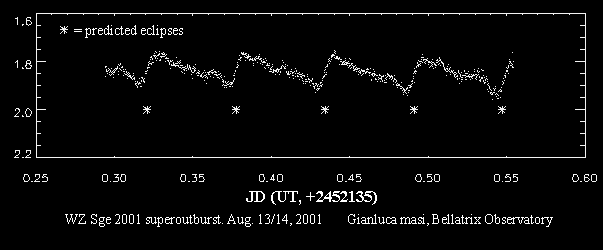
or weak. Eclipses (and their expected times are marked with * on the light curve below) were expected just where the curve peaks; to make them more apparent, I plotted a condensed light curve (points were condesed two by two) and now it is easy to see how there are some very small, but clear eclipse "fingerprints". I performed PDM analysis using "Period", getting an estimate of 0.05774d (using only this run). The star is 0.1 mag. fainter than yesterday, showing some fading over the observing session.

Another observing session was successfully concluded on Aug. 13/14, under a marvelous sky. I grabbed 1340 images in 6.25 hours.
The light curve is, of course, very different from last night, with a fast raising to maximum (in 0.01d) and slower fading (0.048d).
The superhump profile is sometimes very sharp, but it can have a secondary maximum just before to reach the minimum (sometimes the profile is even more complex). Looking carefully, one can see how eclipses affect the light curve during the rising, even if this is a very small effect. The modulation is now of 0.2 mag.
The star faded during the run of about 0.04 mag, being 0.1 mag fainter than yesterday.
I performed PDM analysis on this dataset, adding it to my previous night data, getting a probable period of 0.05728d.
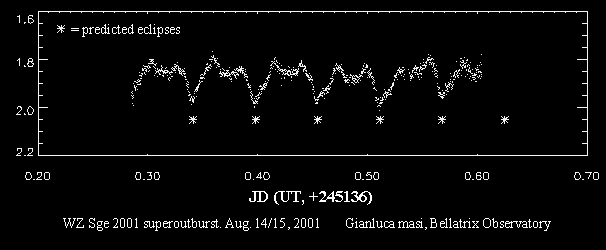
Another observing session was concluded on Aug. 14/15. I grabbed more than 1600 images in 7.6 hours.
O
Once again, the WZ Sge light curve experienced a dramatic change. Eclipses (as announced by Dr. Kato on previous vsnet messages) are now dominating the curve and they occurr at the predicted times. Maxima are quite elaborate: at the beginning of the run there were two main humps, with the one on the left being the stronger. In the middle of the run they were almost equivalen t(on Aug 14.985), while at the end of the session the one on the right is dominant and even higher!
The ascending branch shows aparticular "curvature" on the middle.
The star is at the same magnitude of the end of my previous observing session.
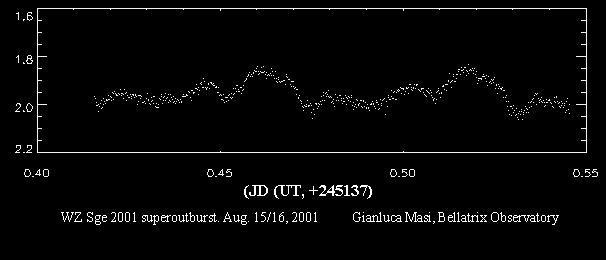
Despite of the passing clouds, I managed to get 3 hours of very beautiful data on Aug. 15/16. The light
curve is amazing: eclipses are deep and the star enters eclipses arriving from its higher
peak. Just after the beginning of recovery, the star experiences a secondary hump, of
about 0.07 mag., with another minor fading, followed by another hump, another fading and,
finally, it reaches the maximum. So, within the phases 0 -> 1, there are three ascending
maxima, starting from the eclipse and ending with the higher one, going directly into the
eclipse.
The star is 0.05 mag. fainter than in my previous observing session.
After a couple of days of pause, I did another 4 hours run on this star, getting good data, even if the star is now not so bright. I used 20s exposures, using, as comparison, GSC 1622:1921.
The curve shows a single hump, quite regular, with some apparent flickering in the bottom part of the curve. Eclipses were occuring during the ascending branch of the hump, which is slower than the following fading from the peak. They are in some way visible in the curve. During the run, the star experienced an apparent fading of 0.05mag.

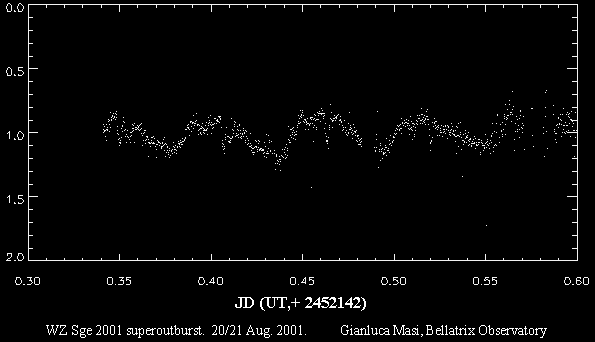
I did additional phoometry of this star on Aug. 19/20. WZ Sge is now showing very large humps, having an amplitude of 0.45mag! Despite of the passing clouds, I recorded three eclipses. They seems to have a
different depth, of the order of 0.07-0.1 mag. The hump profile is quite regular, with a small dip on the ascending branch recorded just one time. I used the star GSC 1621:1758 as comparison.

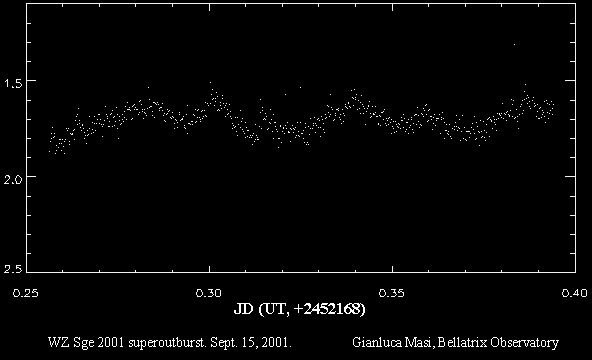
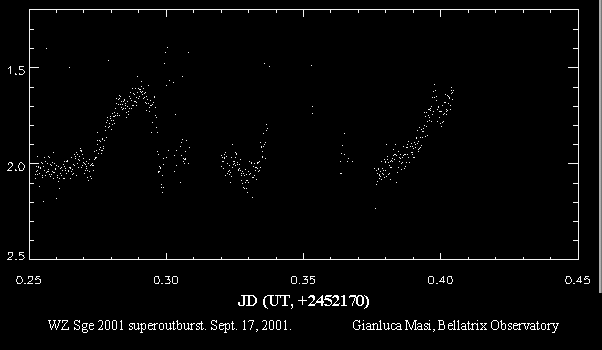
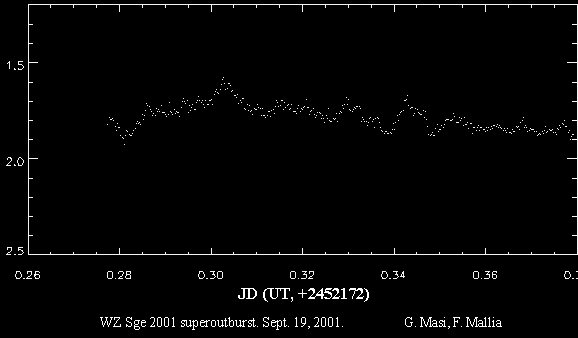
I recommend you to see also this other document: http://www.kusastro.kyoto-u.ac.jp/vsnet/DNe/wzsge01.html
*** download the paper: "The 2001 Superoutburst of WZ Sagittae", by J. Patterson, G. Masi, M. Richmond et al., 2002, PASP 114, pp. 721-747. ***
Visitors of this page:
since July 25, 2001
Visitors of this site:
since April 30, 1997